market_report
6.1 Market
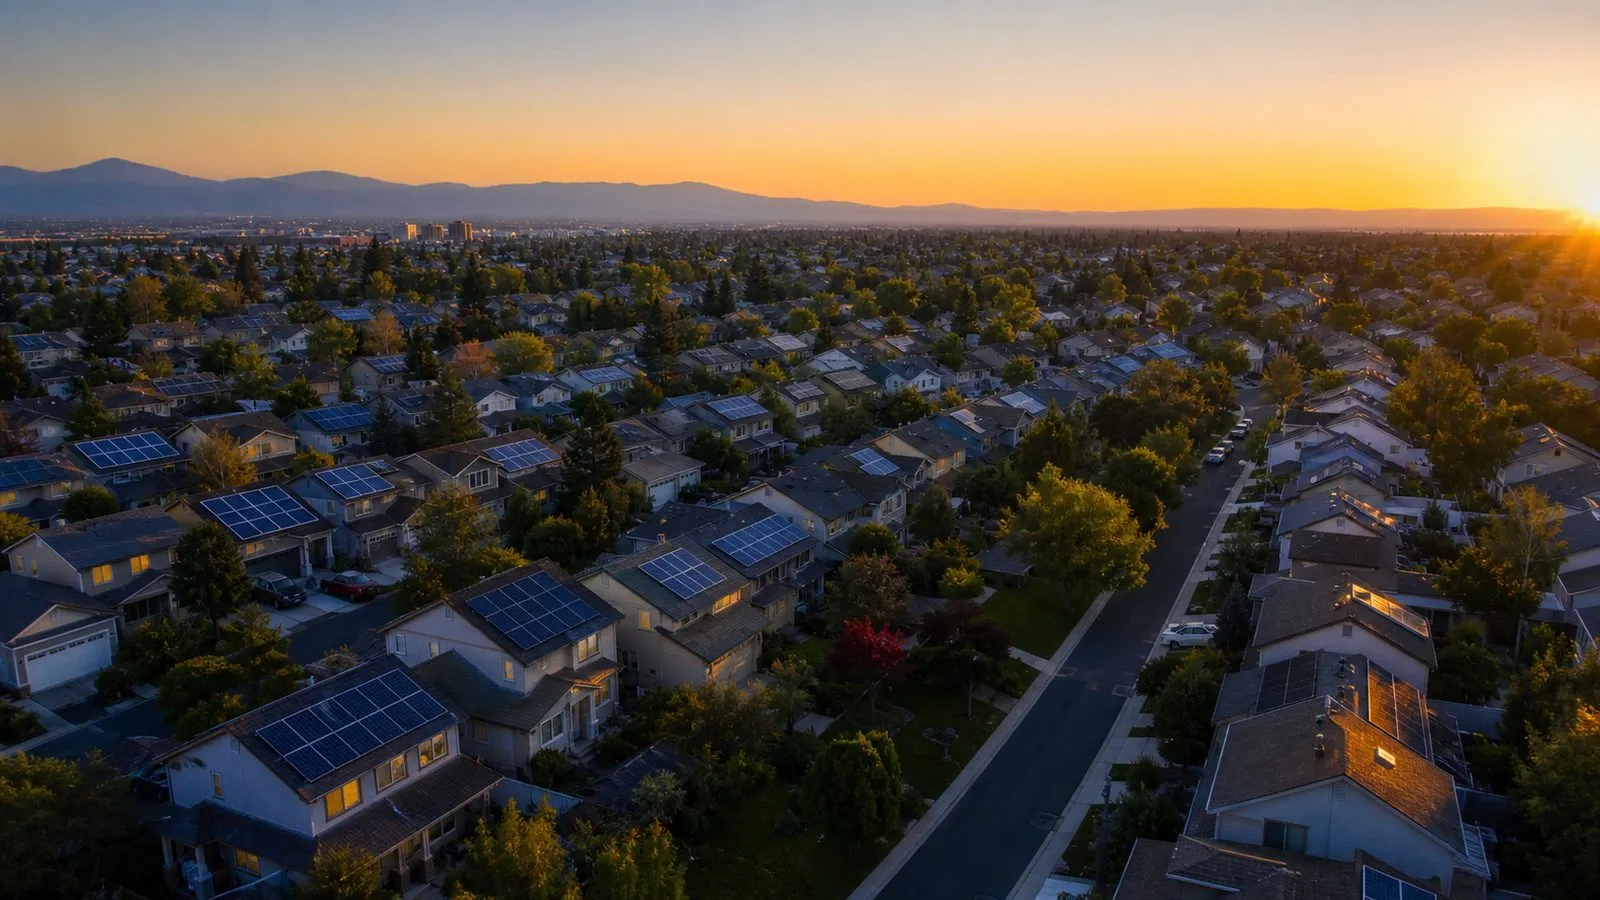
Slide 1 - Cover (LAVisions layout)layout: title_hero · 16:9


Market Opportunity
The market moving onto the cheap side of the grid.
MK 01 / 10
Large, growing and wide open, ready for a whole-home optimiser
A large, mainstream market opening across every US home
$40BEvery US home's yearly power spend software can optimise
US homes x annual electricity spend x optimisable share
Ember analysis, US home energy, 2026
$9BHomes that already own solar and a home battery
Solar-and-battery homes x annual optimisable spend
Ember analysis of US solar-plus-storage homes, 2026
$74.2MThe Year 5 run-rate Ember reaches at 312k homes
312k homes x roughly $19 per home each month
Ember financial model, Year 5 run-rate
MK 02 / 10
why now
Four shifts are opening this market at the same time
01
Time-of-use tariffs
US utilities are moving homes onto hourly pricing, widening the cheap-to-peak spread.
02
Cheap home batteries
Battery prices have fallen sharply, so storage now sits in ordinary homes.
03
EVs and VPPs
EVs are everywhere and grids now pay homes for flexibility through VPP programmes.
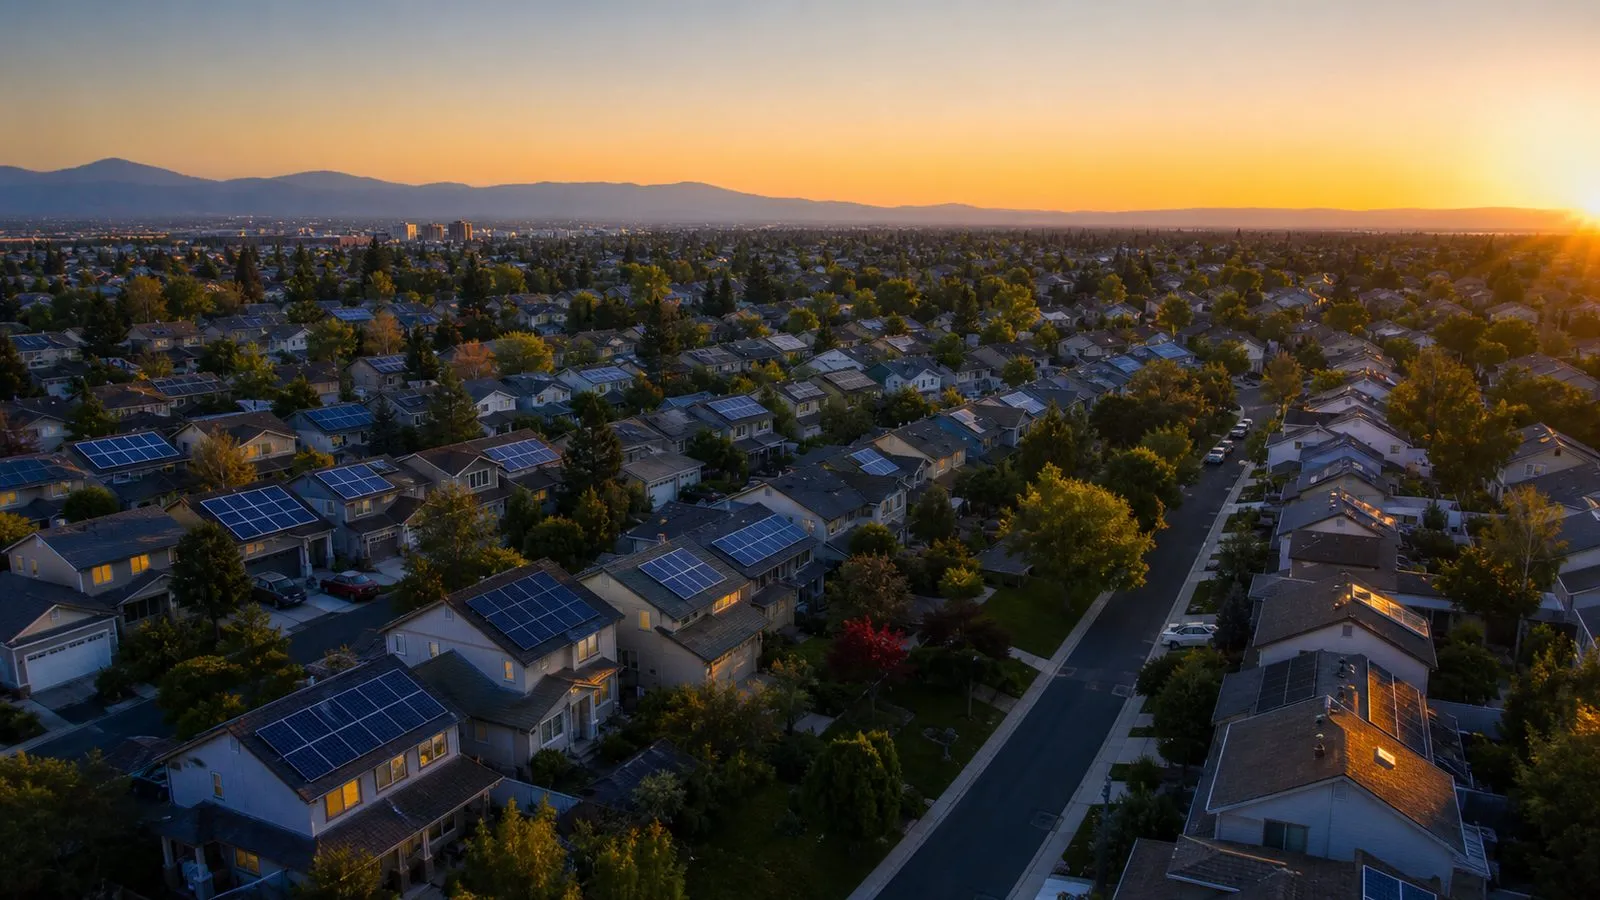
MK 03 / 10
Business model
Software with usage revenue
Main income
Subscriptions at $12 and $29 per home per month
Savings-share keeps 20% of arbitrage, plus grid-services revenue
Unit economics
Unit Economics
Blended revenue per home rises from about $9 to $19 a month

MK 04 / 10
Total Addressable Market
Assumes optimisable share grows as time-of-use tariffs spread
Ember analysis, US home energy, 2026
A bottom-up build from US homes and their energy spend
Total addressable market = Homes x Annual spend x Optimisable share
Segmented by hardware maturity: solar-and-battery homes, solar-only homes, and EV or smart-panel homes, three non-overlapping groups covering the addressable base.
unit_a = addressable US homes in segment; unit_b = annual home electricity spend; unit_c = share of that spend software can optimise
$40B
Solar-and-battery homes
Homes
5M
Annual spend
$1,800
Optimisable share
$1,000
$9B
Solar-only homes
Homes
12M
Annual spend
$1,700
Optimisable share
$750
$9B
EV or smart-panel homes
Homes
25M
Annual spend
$1,760
Optimisable share
$880
$22B
MK 05 / 10
Serviceable Addressable Market
$9B
$40B x 40% x 70% x 85% x 95% = $9B
Filters applied to TAM:
Hardware: home already owns solar and a battery - 40%
excludes homes with no storage to arbitrage
Tariff: on a time-of-use electricity plan - 70%
excludes flat-rate homes with no price spread to capture
Readiness: connected kit Ember can control - 85%
excludes older equipment without an open interface
Reachable: served by a partner installer or utility - 95%
excludes markets Ember has not yet entered
MK 06 / 10
Serviceable Obtainable Market
375k
$74.2M
| Year | Homes | Months paying | Revenue per home | $86.7M |
|---|---|---|---|---|
| Y1 | 0 | 0 | $0 | $0 |
| Y2 | 15k | 12 | $9 | $1.7M |
| Y3 | 69k | 12 | $12 | $12.1M |
| Y4 | 169k | 12 | $16 | $36.2M |
| Y5 | 312k | 12 | $19 | $86.7M |
Active users
MK 07 / 10
Industry Growth and CAGRAbout 20% growth through 2030
Ember analysis, 2026
US home battery installs grew rapidly through 2025 | https://example.com
Utilities expanding time-of-use tariffs across states | https://example.com
EV sales climbing toward a large flexible load | https://example.com
VPP capacity paid by grids scaling each year | https://example.com
MK 08 / 10
Market Challenges
Four barriers keep incumbents out, and each one favours Ember
Fragmented hardware brands
No single app controls solar, battery and EV together
Ember is hardware-agnostic, so fragmentation is our advantage
Slow utility procurement
Grid programmes take months to certify and integrate
Early certifications build a moat competitors must repeat
Consumer trust in savings
Homeowners doubt vague savings claims from apps
Savings-share means Ember is paid only when the home saves
Tariff complexity
Time-of-use plans vary by utility and confuse buyers
Ember's forecasting turns tariff complexity into automatic savings
MK 09 / 10
Key Takeaway
Large, growing, underserved, ready for a whole-home optimiser

Total Addressable Market
$40B
Serviceable Addressable Market
$9B
Serviceable Obtainable Market
$74.2M
Compound Annual Growth Rate
20%

MK 10 / 10